Biscuits and cakes - Page 6
Belongs to:
Contains:
- Biscuit with chocolate covering
- Biscuits
- Brookies
- Cakes
- Coated chocolate bar without biscuit
- Cone wafer for ice cream
- Diet crispy biscuit
- Frozen cakes and pastries
- Fruit biscuits
- Gingerbreads
- Jaffa cakes
- Pastries
- Reduced fat biscuit bar filled with fruits
- Savoy-style sponge cake
- Snack biscuit with fruits filling
- Thin biscuits with fruits
- Fruit-filled biscuits
A biscuit is a flour-based baked food product, which is typically hard, flat and unleavened.
Nutrition facts
Average nutrition facts for the 2000 products of the Biscuits and cakes category for which nutrition facts are known (out of 2238 products).
| Nutrition facts | As sold for 100 g / 100 ml |
Standard deviation | Minimum | 10th centile | Median | 90th centile | Maximum |
|---|---|---|---|---|---|---|---|
| Energy |
1,820 kj (435 kcal) |
272 kj (64 kcal) |
0.205 kj (2 kcal) |
1,290 kj (312 kcal) |
1,860 kj (446 kcal) |
2,170 kj (518 kcal) |
4,860 kj (2110 kcal) |
| Fat | 19.2 g | 6.38 g | 0 g | 8 g | 20.2 g | 28.2 g | 211 g |
| Saturated fat | 8.78 g | 4.63 g | 0 g | 1.9 g | 8.7 g | 16.6 g | 45 g |
| Monounsaturated fat | 5.08 g | 2.9 g | 0.2 g | 1.6 g | 5.33 g | 11.1 g | 12.7 g |
| Polyunsaturated fat | 2.06 g | 1.29 g | 0 g | 0.4 g | 1.9 g | 5 g | 16.1 g |
| Trans fat | 0.002 g | 0.009 g | 0 g | 0 g | 0 g | 0 g | 0.2 g |
| Cholesterol | 18.3 mg | 29.9 mg | 0 mg | 0 mg | 0 mg | 83 mg | 87 mg |
| Carbohydrates | 57.8 g | 9.57 g | 0.2 g | 37 g | 59.9 g | 70 g | 106 g |
| Sugars | 28 g | 10.5 g | 0 g | 11.7 g | 28 g | 45 g | 96.5 g |
| Starch | 24.6 g | 12.4 g | 0.5 g | 6.3 g | 24.2 g | 44.6 g | 63.7 g |
| Fiber | 2.6 g | 1.53 g | 0 g | 0.8 g | 2.3 g | 6 g | 33.7 g |
| Proteins | 5.56 g | 1.52 g | 0 g | 3.2 g | 5.5 g | 8.2 g | 76 g |
| Salt | 0.511 g | 0.263 g | 0 g | 0.16 g | 0.49 g | 1 g | 24 g |
| Alcohol | 0 % vol | 0 % vol | 0 % vol | 0 % vol | 0 % vol | 0 % vol | 0 % vol |
| Vitamin A | 91.8 µg | 129 µg | 0 µg | 0 µg | 0 µg | 300 µg | 500 µg |
| Vitamin C (ascorbic acid) | 0 mg | 0 mg | 0 mg | 0 mg | 0 mg | 0 mg | 10.6 mg |
| Vitamin B1 (Thiamin) | 0.254 mg | 0.369 mg | 0 mg | 0 mg | 0 mg | 0.94 mg | 2 mg |
| Vitamin B3/PP (Niacin) | 5.62 mg | 4.5 mg | 0.205 mg | 1.92 mg | 3.85 mg | 14 mg | 14,000 mg |
| Potassium | 80.4 mg | 65.8 mg | 0 mg | 0 mg | 100 mg | 207 mg | 667 mg |
| Calcium | 100 mg | 114 mg | 0 mg | 0 mg | 52 mg | 333 mg | 357 mg |
| Iron | 2.93 mg | 1.53 mg | 0 mg | 0.016 mg | 3.46 mg | 5.5 mg | 12 mg |
| Magnesium | 101 mg | 44.6 mg | 1 mg | 9 mg | 112 mg | 143 mg | 144 mg |
| Fruits‚ vegetables‚ nuts and rapeseed‚ walnut and olive oils (manual estimate from ingredients list) | 19.8 % | 15.5 % | 1 % | 3 % | 17 % | 47 % | 96 % |
Country: United Kingdom - View matching products from the entire world
2,240 products
-
2 Cream Slices - Tesco - 130g
-
Mini Mince Pies - Morissons
-
Blissfuls Belgian Chocolate & Hazelnut - McVitie's - 172g

-
Spices & Citrusy Clementine Shortbread Fingers - Tesco Finest - 8 biscuits, 165g
-
Brookie mini bites - Rowan hill bakery - 20
-
Bramley Apple & Blackberry Crumble - Cook - 1070g
-
Alphabet Biscuits - Organix

-
Danish traditional butter cookies

-
Triple chocolate cookies - Belmont
-
Malted Milk - Coop - 200g

-
Lemon cheesecake - Asda

-
Savoiardi Sponge Fingers, Taste the Difference - Sainsbury's - 200g
-
Free from gingerbread men - Tesco
-
Chocolate Chunk Muffins - Rowan Hill Bakery - 288 g
-
Viscount - Lyons' Viscount Biscuits

-
Pains aux raisins - Marks & Spencer

-
Victoria sponge slice gluten free - Morrisons
-
Hedelmä välipalakeksi - 10 x 30 g
-
4 Cheese & Black Pepper English Muffins - Tesco Finest
-
2 Tiramisu - Tesco - 170 g (2 x 85 g)
-
Maryland Vegan Cookies

-
Organic Manuka Honey Oatcakes
-
Thorntons triple layer chocolate cake
-
Oatmeal and raisin cookies - By sainsbury's

-
biscuits made by an? - f3yegge - gwhbeg
-
Panettone (Freefrom) Waitrose - 100g
-
Girl Scout Cookies

-
Mini meringues - 90 g

-
Nice biscits - By sainsbury's

-
Mixed berry cheesecake - - 500g

-
Oat Shortbread - walkers

-
Jam dougnuys - By sainsbury's

-
Bramley apple crumble - Morrisons - 270 g
-
Mini BN

-
Oaty apple crumble
-
Fibre One 90 - Strawberry Cheesecake Bars - General Mills - 4, 25 g bars
-
Jaffa Cakes - Morrisons

-
CBD Infused Cookie Chocolate Orange Flavour - naturecan - 60g
-
Spinach and feta parcels - Waitrose

-
Belgian milk chocolate florentines - Morrisons
-
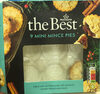
The Best Mini Meringues - Morrisons
-
Cream Wafer Bar - Caramelised Biscuit - Love Raw

-
Chocolate fudge cupcakes - Tesco
-
Cheese and Onion pastries - Morrisons - 520 g

-
Choc chip muffin
-
Wafer rolls
-
Scottish shortbread selection - Morrisons

-
TTD Chocolate and salted caramel hot cross buns

-
Half and half cake - Tesco
-
Apple and cinnamon hot cross buns

-
M&S Heavenly Chocolate - Marks and Spencer
-
6 frangipane tarts - Asda
-
Paterson's shortbread fingers - 300 g
-
Apple & raisin strudel
-
Waitrose
-
18 Chocolate Chip Cookies - The Daily Bakery
-
Chocolate & Hazelnut Baci
-
McVitie's - 300 g

-
McVitie’s Digestive Dark Chocolate Biscuits

-
Mikado & Go Milk Chicolate - Glico - 1x 39g
-
Chocolate cake slices - Tesco
-
All butter Shortbread Biscuits - Ringtons - 200g
-
Havreflarn - Berthas - 300g
-
Cheddar & Caramelised Onion Chutney Rolls - Higgidy - 54g

-
Hazelnut Praline Zillionaire Cheesecakes - Gü - 173g
-
Stollen Slices - Aldi Specially Selected

-
Cinnamon Buns - Waitrose
-
Crunchie doughnuts - Cadbury

-
8 x 19 g

-

-

-
JIVE LOADED BROWNIES - Aldi -Dairyfine
-
pear soft biscotti - kiddyliciuos - 6 x 20g
-
Reese’s Peanut Butter Cups Miniature - Reeses - 70 g
-
Reese’s Peanut Buttercups Miniature - 70g
-
Mochi - Little moons

-

-
Chocolino Bites - Nutini - 8 packs 200g

-

-

-
-

-
Tiramisù - Franco Manca - 170g

-
Belvita Breakfast Biscuits Milk & Cereal

-
2 x 145 g
-
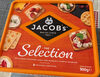
Jacob’s Biscults for Cheese Selection - 900 g
-
Cake basket 3 double chocolate muffins
-
-
Dark Chocolate, Caramel and Sea Salt Cookies - Sainsbury’s - 4
-
Huel V3.1 Powder - Salted Caramel - Trader Joe's - 1 pouch

-
Choco muffin - St Michel - 180g
-

-
-

-
Rich Iced Fruit Cake - Aldi - 400g
-
Chocolate Chunk Cookies - Wild Bean Cafe - 4 cookies of unknown weight

-
150 g
-
Creme Egg Cakes - Cadbury - 4
-
-
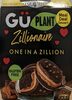
Plant Zillionare - Gü - 2x91.5g