Dairies - Page 13
Contains:
Nutrition facts
Average nutrition facts for the 3201 products of the Dairies category for which nutrition facts are known (out of 3543 products).
| Nutrition facts | As sold for 100 g / 100 ml |
Standard deviation | Minimum | 10th centile | Median | 90th centile | Maximum |
|---|---|---|---|---|---|---|---|
| Energy |
876 kj (211 kcal) |
585 kj (140 kcal) |
0 kj (0 kcal) |
209 kj (50 kcal) |
668 kj (163 kcal) |
1,740 kj (416 kcal) |
5,800 kj (1390 kcal) |
| Fat | 14.8 g | 13.6 g | 0 g | 0.5 g | 9 g | 35 g | 116 g |
| Saturated fat | 9.31 g | 8.62 g | 0 g | 0.3 g | 5.5 g | 22 g | 72.3 g |
| Monounsaturated fat | 7.32 g | 5.22 g | 0.009 g | 1.6 g | 6.3 g | 20.1 g | 27.4 g |
| Polyunsaturated fat | 0.976 g | 0.634 g | 0 g | 0.2 g | 1 g | 2.2 g | 12 g |
| Carbohydrates | 5.97 g | 5.18 g | 0 g | 0.3 g | 4.7 g | 16 g | 96 g |
| Sugars | 4.56 g | 4.21 g | 0 g | 0.1 g | 4 g | 13 g | 96 g |
| Starch | 1.49 g | 1.29 g | 0.2 g | 0.3 g | 1.8 g | 4.4 g | 15 g |
| Fiber | 0.346 g | 0.399 g | 0 g | 0 g | 0.4 g | 1.1 g | 33 g |
| Proteins | 9.89 g | 8.42 g | 0 g | 2.1 g | 5.1 g | 25.3 g | 84.7 g |
| Salt | 0.687 g | 0.71 g | 0 g | 0.1 g | 0.2 g | 1.81 g | 106 g |
| Alcohol | 0 % vol | 0 % vol | 0 % vol | 0 % vol | 0 % vol | 0 % vol | 0 % vol |
| Vitamin A | 327 µg | 342 µg | 0 µg | 0 µg | 265 µg | 800 µg | 1,340 µg |
| Vitamin D | 21 µg | 118 µg | 0 µg | 0.46 µg | 0.9 µg | 7.5 µg | 200,000 µg |
| Vitamin B2 (Riboflavin) | 0.194 mg | 0.207 mg | 0 mg | 0.1 mg | 0.14 mg | 1.2 mg | 2,500 mg |
| Vitamin B6 (Pyridoxin) | 0.343 mg | 0.3 mg | 0.13 mg | 0.21 mg | 0.21 mg | 1.2 mg | 1.79 mg |
| Vitamin B12 (cobalamin) | 0.877 µg | 0.881 µg | 0.001 µg | 0.22 µg | 0.57 µg | 2.5 µg | 200,000 µg |
| Calcium | 251 mg | 228 mg | 0 mg | 105 mg | 134 mg | 740 mg | 900,000 mg |
| Fruits‚ vegetables‚ nuts and rapeseed‚ walnut and olive oils | 8.33 % | 3.74 % | 1 % | 2 % | 8.9 % | 13.5 % | 30 % |
| Fruits‚ vegetables‚ nuts and rapeseed‚ walnut and olive oils (manual estimate from ingredients list) | 9.22 % | 4.51 % | 2.1 % | 3 % | 9.4 % | 20 % | 22 % |
Country: United Kingdom - View matching products from the entire world
3,552 products
-
Raspberry and passion fruit layered yogurt - lidl - 150 g
-
Fat free coco nut Greek style yoghurt - Mortisons - 4 x 125 g
-
Käse Cheddar, kräftig-würzig, 14 Mon. gereift - Hochland Deutschland GmbH - 200 g

-
Mandarin & lime layered yogurt - Lidl - 150 g
-
Muller Rice - 6 x 170 g

-
Half fat British mature cheddar slices
-
Welsh semi skimmed milk
-
Red Leicester - Co Op - 240 g
-
Lactose free milk - Asda

-
Cottage cheese - Asda
-
Skimmed milk - By sainsbury's
-
Truffle cheddar - Marks & Spencer
-
natural coconut yog - the coconut collab - 100g
-
Little Yeos Organic Banana & Custard - Yeo Valley - 4X85g

-
Maison Lescure Demi Sel AOP - 200 g

-
Mild Cheddar - Asda

-
Somerset Goat's Cheese - Sainsbury's
-
Parmigiano Reggiani DOP - Milbona - 200 g
-
Corner plant-based strawberry & pomegranate - Müller - 136g
-
Lighter Grated Mature British Cheese - By Sainsbury's - 250 gm

-
FAGE Total Low-fat strained yoghurt 2% 1kg

-
Tworóg półtłusty - Łowicz - 250 g
-
Cheese snack box - Duc de Coeur - 425g
-
Vanilla milk drink - Yazoo - 400 ml

-
Live set natural yoghurt - Pakeeza Live set natural yoghurt - 900g
-
Creamy Greek whipped style - Milbona

-
British mild cheddar - Sainsbury's - 270g

-
Light devon custard light - Ambrosia - 150g

-
Halloumi - Papouis - 4 x 250 g
-
Red berries

-
Balsamic Onion & Vintage Tart - Waitrose & Partners
-
Cheese and onion bakes - Iceland - 2 x 141g

-
Grana Padano - Sainsburys
-
Morrisons

-
Chocolate milkshake
-
Nourish - Morrisons

-
Cheddar Cheese, mild - Stamford Street Co

-
Dodoma Authentieke Griekse Yoghurt 10% Vet - Dodoni - 170
-
West Country Farmhouse Butter - Sainsbury's Taste The Difference - 250g

-
Elmlea whipped cream

-
Cheese slices
-
Caramel yogurt - Lidl - 150 g
-
Strawberry greek yogurt

-
Babybel
-
Tasty cheddar cheese
-
Evaporated milk - Essential Waitrose

-
Mint Collection - Elizabeth Shaw - 200g

-
Gingerbread Milkshake - Marks & Spencer

-
Skyr drinking yogurt Strawberry & Kiwi

-
Appeteasers Provence mix - 100g (20*5g)

-
Mozzarella & Cheddar - Morrisons
-
Cheese - Collier’s celtic - 350 g

-
Extra mature Cumbrian cheddar - Sainsbury's

-
Feta salad - Morrisons

-
Greek Recipe Strained Yoghurt with Strawberry - FAGE - 100g

-
Milbona - Milbona - Lidl - 200 g

-
skimmed milk - Waitrose

-
Milbona - 200 g

-
Salted dairy fat spread (60% fat content) - Elle&Vire International - 200 g
-
Semi skimmed milk - Iceland - 2.272L
-
White Mature Cheddar - Orkney - 200 g
-
Chocolate Meal Shake - Slimfast - 325ml

-
Asda
-
Handmade Vintage Cheddar 30 Months Matured - Lidl - 400g

-
10 cheese singles - Asda
-
Organic Whole British milk - Marks & Spencer
-
Halloumi - Asda
-
Live Creamy Natural Yogurt

-
Skimmed Milk - Essential Waitrose
-
Custard - Marks & Spencer

-
devonshire luxury yogurt - Marks & Spencer

-
30% reduced fat mature cheese - Tesco - 400 g

-
Mild British cheddar cheese - Asda
-
Mandarin & Lime Greek Style Yogurt
-
Fat free natural yogurt - Asda
-
Mozzarella - Caseificio Villa - 4 x 125 g

-
Medium cheddar - Essential Waitrose
-
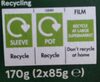
2 Tiramisu - Tesco - 170 g (2 x 85 g)
-
Halloumi fries - Lidl
-
Vanilla Custard Rice - Brooklea

-
Cathedral city with Branston pickle - 11

-
Edam Slices - By sainsbury's
-
Lindahls Kvarg white chocolate - 150g
-
Cadbury Flake Chocolate Dessert - 75 g
-
Protein Pudding - Lindahls - 140 g

-
Nesquik Carmen choco - Nestlé

-
Condensed Milk - Nestlé
-
Bliss corner - Muller - 4 x 10⁵ g
-
Arla

-
RED DEVIL - SNOWDONIA CHEESE XOMPANY - 200g

-
Mango & Passion fruit yogurt - Marks & Spencer

-
Italian Grated Cheese - Loyd Grossman - 80g

-
Chorizo and gouda - Aldi The deli - 80g
-
Reduced fat grated cheese - Morrison’s
-
Thicke & creamy - Lichfields - 20 x 125g

-
Protein Chocolate Flavour Shake - For Goodness Shakes - 435ml

-
Morrisons - 500 g
-
president Lighter - 250g

-
Greek style salad cheese - taverna - 200 g
-
Maasdamer - Rewe Bio - 150 g