Desserts - Page 11
Contains:
- Baklava
- Black Forest gâteau
- Charlottes
- Chocolate desserts
- Chocolate soft cake
- Clafoutis
- Coffee desserts
- Compotes
- Crumbles
- Dairy desserts
- Floating island
- French toast
- Frozen desserts
- Fruit liegeois
- Fruits compote with reduced sugar
- Fruits desserts
- Fruits in syrup
- Fruits puree without sugar added
- Gazelle horn
- Goblet of Belle Helene pear ice cream
- Goblet of chocolate ice cream topped with whipped cream
- Goblet of coffee ice cream topped with whipped cream
- Goblet of peach Melba ice cream
- Jelly desserts
- Kadaif
- Liégeois
- Macarons
- Meringue roulades
- Mochi
- Non-dairy desserts
- Panforte
- Peach melba with vanilla ice cream and raspberry sauce
- Puddings
- Refrigerated desserts
- Shelf stable desserts
- Soft cake filled with chocolate
- Soft cake filled with fruit paste and coated with sugar icing
- Sponge cake with fruit mousse
- Sponge cakes
- Sponge puddings
- Sushki
- Sweet mousses
- Tartufo
- Trifles
- es:Roscón
- fi:Mämmi
- fr:Bûches pâtissières
- fr:Pastel de nata
Nutrition facts
Average nutrition facts for the 1977 products of the Desserts category for which nutrition facts are known (out of 2181 products).
| Nutrition facts | As sold for 100 g / 100 ml |
Standard deviation | Minimum | 10th centile | Median | 90th centile | Maximum |
|---|---|---|---|---|---|---|---|
| Energy |
662 kj (154 kcal) |
382 kj (89 kcal) |
2 kj (0 kcal) |
251 kj (59 kcal) |
523 kj (123 kcal) |
1,390 kj (335 kcal) |
5,540 kj (1320 kcal) |
| Fat | 6.3 g | 5.25 g | 0 g | 0.4 g | 5 g | 17.1 g | 80 g |
| Saturated fat | 3.78 g | 3.27 g | 0 g | 0.1 g | 2.9 g | 10 g | 55 g |
| Monounsaturated fat | 2.15 g | 0.793 g | 0.1 g | 1.1 g | 2.2 g | 3.9 g | 6.1 g |
| Polyunsaturated fat | 0.586 g | 0.477 g | 0.1 g | 0.1 g | 0.4 g | 1.5 g | 2.5 g |
| Carbohydrates | 19.5 g | 13.1 g | 0 g | 5.1 g | 15.4 g | 50 g | 172 g |
| Sugars | 14.6 g | 8.44 g | 0 g | 4.1 g | 13 g | 29.2 g | 96 g |
| Starch | 7.28 g | 6.82 g | 0.2 g | 0.3 g | 6.3 g | 17.5 g | 18.4 g |
| Fiber | 0.988 g | 0.944 g | 0 g | 0 g | 0.6 g | 3.1 g | 25 g |
| Proteins | 3.97 g | 1.96 g | 0 g | 1.2 g | 3.7 g | 8 g | 77 g |
| Salt | 0.161 g | 0.082 g | 0 g | 0.08 g | 0.14 g | 0.31 g | 71.3 g |
| Alcohol | 0 % vol | 0 % vol | 0 % vol | 0 % vol | 0 % vol | 0 % vol | 0 % vol |
| Vitamin A | 0 µg | 0 µg | 0 µg | 0 µg | 0 µg | 0 µg | 120 µg |
| Vitamin D | 27.7 µg | 139 µg | 0 µg | 0 µg | 0.75 µg | 3.4 µg | 200,000 µg |
| Vitamin C (ascorbic acid) | 5.26 mg | 6.19 mg | 0 mg | 0 mg | 1.6 mg | 15 mg | 67.2 mg |
| Vitamin B2 (Riboflavin) | 0.212 mg | 0.031 mg | 0.12 mg | 0.21 mg | 0.21 mg | 0.27 mg | 0.27 mg |
| Vitamin B12 (cobalamin) | 0.387 µg | 0.046 µg | 0.19 µg | 0.3 µg | 0.38 µg | 0.49 µg | 200,000 µg |
| Calcium | 133 mg | 23.1 mg | 0 mg | 100 mg | 125 mg | 180 mg | 86,400 mg |
| Fruits‚ vegetables‚ nuts and rapeseed‚ walnut and olive oils | 8.51 % | 3.64 % | 1 % | 2 % | 9 % | 21 % | 56 % |
| Fruits‚ vegetables‚ nuts and rapeseed‚ walnut and olive oils (manual estimate from ingredients list) | 13.9 % | 11.8 % | 2.1 % | 3 % | 10 % | 47 % | 100 % |
Country: United Kingdom - View matching products from the entire world
2,187 products
-
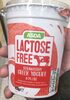
Strawberry greek yogurt - Asda - 450 g
-
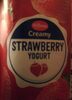
creamy strawberry yogurt - Milbona
-
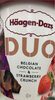
Haagen Dazs belgian chocolate and strawberry crunch ice cream
-
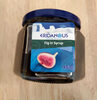
Fig in syrup - Eridanous - 453g
-
Doughnut bites 30 pack - Costco

-
Apricot yogurt

-
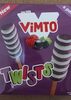
Twists
-
Millions Blackcurrant Buzz Ice Lolly -

-
Muller

-
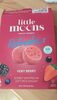
Mochi sorbet refreshos very berry - Little Moons
-
Dark chocolate

-
Deluxe Mixed Berries & Lemon Roulade - Lidl - 450g

-
Co-op irresistible West Country cream lemon curd yoghurt - 150g

-
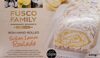
Scilian Lemon Roulade - Fusco Family - 400g
-
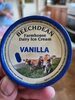
Beechdean Farmhouse Diary Ice Cream
-
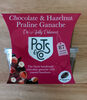
Chocolate & hazelnut praline ganache - Pots&Co - 190g
-
Strawberry ice cream

-
bon gelati premium ice cream - Lidl - 6 x 84 g

-
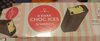
6 Dark Choc Ices - By sainsbury's
-
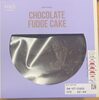
Chocolate Fudge Cake - Marks & Spencer
-
Muller Rice Strawberry - 180 g

-
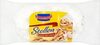
Stollen Luxury-Marzipan - Kuchenmeister - 200 g
-
Waitrose Meringue Nests 8pk - 30g

-
Deliciously nutty - Hazelnut low fat yogurt - Waitrose - 150 g
-
Lemon cheesecake - Morrisons - 470 g
-
Blueberry Yoghurt - Longley Farm - 150 g

-
Divine Rice Traditional - Rachel's - 500 g
-
0% Fat Vanilla Yogurt - Onken
-
Magnum 100ML Mint
-
Greek style yogurt - Rowan Glen
-
Skyr - Graham's - 450g
-
Sea salted caramel icecream - Yeo Valley - 500ml

-
Fruit Collection - Häagen-Dazs - 1 x 100 g
-
Soya yogurt -

-
Layers of Joy Chocolate Trifle Desserts 2 x - Cadbury - 180g
-
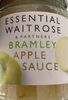
Bramley apple sauce - Waitrose - 20g
-
Chocolate melt in the middle puddings - Marks & Spencer - 310 g
-
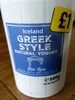
Greek Style Natural Yogurt - Iceland - 500g
-
Seriously chocolatey chocolate cake

-
Giannis Real Diary Ice Cream Traditional - ALDI

-
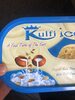
Kulfi Ice Original Malai - 1 litre
-
Strawberries and Cream - Lidl - 900 ml

-
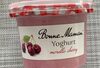
Yoghurt Morello Cherry - Bonne Maman - 450g
-
Créme Brûlée - Aldi Dessert Menu - 2 x 100g

-
Fromage frais - Tesco - 360g

-
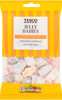
Jelly Babies - Tesco - 250g
-
Strawberry Swirl Cheesecake - Confiserie Firenge - 375g

-
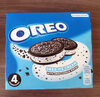
Oreo ice cream with oreo cookie pieces - 220 ml
-
10cal - Hartley's - 175g

-
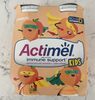
Actimel Kids - Peach
-
Yaourt goûts : vanille, framboise, pêche et fraise - Activia
-
Yoghurt - Pakeeza
-
Chocolate brownie ice cream - Giannis - 325 g

-
Baklava Selection - Waitrose
-
Ben & Jerrys salted caramel brownie - 391g

-
Mint choc chip - Asda
-
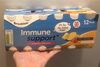
Immune Support Yoghurt Drink - Brooklea
-
Chocolate and cream - - 4 x 60 g

-
Protein Yogurt Strawberry - Aldi - 230g

-
Chocolate White Sticks - Tesco - 330ml
-
SKYR Icelandic Style Yogurt - Aldi

-
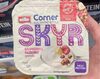
Corner Icelandic style Skyr - Muller - 170 g
-
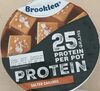
Protein Pot - Aldi
-
Cloudy lemonade ice lollies

-
Gelatelli bourban vanilla ice cream coated with betry sorbet - Lidl - 198g
-
Vanilla pouch -

-
Fudge Yogurt - Lidl - 150g

-
Rob & nick ice cream Vanilla

-
Fruity Pops - 100 x 8 g
-
Vanilla clotted cream

-
Supreme Honeycomb - Lidl
-
Mango Whole Milk Yoghurt - Little Yeos

-
Cadbury Dairy Milk Choc Tops

-
Passion fruit and lemon roulade - 420 g

-
Strachan's Scottish Dairy Ice Cream - Scottish Tablet

-
Buzz Chocolate Ice Cream
-
Yoghurt flavoured ice cream with fig sauce - Eridanous

-
Neapolitan soft scoop - Marks & Spencer

-
Raspberry ripple ice cream - Tesco

-
Victoria plum and bergamot yogurt - M&S

-
Organic Greek style yoghurt - Marks &Spencer - 500g

-
Alcohol free Christmas pudding - Marks & Spencer - 454g
-
Lemon curd West Country Yogurt - Sainsbury's - 150 g
-
Waitrose natural greek yogurt - 200 g
-
Strawberry trifle - Tesco
-
Raspberry Yogurt - Longley Farm - 150 g

-
yoghurt - Longley Farm - 150 g

-
St Helen's Farm-Natural Goats Milk Yoghurt - St Helens - 450 gr

-
Peach / Mango Yoghurt - Rachel's Organic - 440 g (4 x 110 g)

-
Rachel's Organic Greek Style Natural yogurt - 450g
-
Laura - Nestle - 6 x 60 g

-
Black cherry luxury yougart - Asda - 150g

-
Moose - Asda - 360 g

-
Onken natural 0% fat - 150 g

-
0% Fat Greek Style Yoghurts - Tesco
-
Raspberry - Waitrose - 150 g
-
Vla Leicht Vanille - Zuivelhoeve - 500 g

-
Greek style yogurt vanilla flavour - Liberté
-
Vanilla light ice cream - Carte d'Or - 500g

-
Blue - Day Up - 120g
