Salted spreads
Belongs to:
Contains:
- Ajvar
- Anchovy paste
- Artichoke spreads
- Baba ghanoush
- Bean spreads
- Bruschetta spreads
- Cheese spreads
- Cheese spreads substitutes
- Egg salads
- Egg salads substitutes
- Eggplant caviar
- Hummus
- Ktipiti
- Lentil spreads
- Muhammara
- Rillettes
- Savory mousses
- Squash caviar
- Sweet potato spreads
- Tapenades
- Taramasalata
- Vegan vegetable spreads
- Vegetarian spreads with meat-like pieces
- Yeast extract spreads
Nutrition facts
Average nutrition facts for the 377 products of the Salted spreads category for which nutrition facts are known (out of 395 products).
| Nutrition facts | As sold for 100 g / 100 ml |
Standard deviation | Minimum | 10th centile | Median | 90th centile | Maximum |
|---|---|---|---|---|---|---|---|
| Energy |
1,130 kj (268 kcal) |
364 kj (84 kcal) |
244 kj (58 kcal) |
614 kj (148 kcal) |
1,070 kj (254 kcal) |
1,860 kj (443 kcal) |
3,690 kj (715 kcal) |
| Fat | 21.1 g | 12.4 g | 0.1 g | 3 g | 20 g | 46 g | 79 g |
| Saturated fat | 4.48 g | 4.43 g | 0 g | 0.7 g | 2.5 g | 14 g | 36 g |
| Monounsaturated fat | 13.5 g | 5.96 g | 4.8 g | 7 g | 14.3 g | 22.4 g | 23 g |
| Polyunsaturated fat | 11.3 g | 7.89 g | 0.1 g | 0.5 g | 9.2 g | 23.5 g | 39 g |
| Carbohydrates | 8.88 g | 5.24 g | 0 g | 0.6 g | 9.3 g | 16 g | 69.6 g |
| Sugars | 1.76 g | 1.59 g | 0 g | 0.5 g | 1 g | 5 g | 62.3 g |
| Fiber | 3.12 g | 2.06 g | 0 g | 0 g | 3.92 g | 5.6 g | 8.9 g |
| Proteins | 6.12 g | 3.47 g | 0 g | 0.5 g | 6.6 g | 11.9 g | 48.6 g |
| Salt | 1.03 g | 0.442 g | 0 g | 0.5 g | 0.91 g | 1.8 g | 10.8 g |
| Vitamin A | 637 µg | 282 µg | 120 µg | 125 µg | 800 µg | 800 µg | 800,000 µg |
| Vitamin D | 6.83 µg | 2.01 µg | 0.8 µg | 7.5 µg | 7.5 µg | 7.5 µg | 7.5 µg |
| Vitamin B9 (Folic acid) | 1,300 µg | 850 µg | 50 µg | 50 µg | 1,250 µg | 2,500,000 µg | 2,500,000 µg |
Country: United Kingdom - View matching products from the entire world
395 products
-
Yeast Extract - Marmite - 250 g

-
Marmite Yeast Extract - 500g
-
Olive oil spread - Bertolli - 450 g
-
Philadelphia - Mondelez International - 165g
-
Dairy Free Spread - Vitalite- suitable for Vegan - 500 g

-
Garlic & Herbs Soft French Cheese - Boursin - 150g

-
flora 100% natural

-
Ramona's Heavenly Houmous - 500g
-
Lighter spread - Flora - 450 g
-
Marmite yeast extract - 125 g ℮
-
Spread - Clover - 500g
-
Full Fat Soft Cheese Original - Milbona - 200 g
-
Mighty Yeast Extract - marmite

-
proactiv - Flora proactiv - 450g

-
Sabra Houmous Extra - ASDA - 200g
-
Reduced Fat Soft Cheese - Milbona - 200 g

-
Houmous - The Deli - 200 g

-
Vegemite - Sainsburys Taste the Difference Taste the difference - 220g
-
Marmite Reduced Salt - 250 g

-
Philadelphia Light - Tesco - 165g

-
Organic houmous - TESCO - 200g
-
-
Olive Spread - Kerry Foods - 500g

-
Jalapeno Houmous - Ramona's - 500g
-
Maribel Yeast Extract Vegan - Lidl - 240g
-
Philadelphia - 150g
-
butterpack spreadable - Tesco - 500g
-
Tesco Houmous - 200g

-
Light - Benecol - 500g

-
Dairy Free Sunflower Spread - Pure - 500g
-
Greenvale - Olive spread - 500 g

-
Bertolli light - 450 g

-
Classic Houmous - Sainsbury's - 200 g

-
Organic Houmous - Sainsbury's - 200 g
-
Hummus Garlic + Red Pepper - Sabra - 200 g

-
Cream Cheese - Paysan Breton - 150 g
-
Olive Spread - Tesco - 500 g
-
Plant butter - FRUIT D'OR - 500g
-
Houmous - Waitrose Duchy Organic - 200 g
-
Houmous - Tesco - 200g

-
Philadelphia light

-
Yeast extract - Tesco - 225g

-
Light fat spread - Clover - 500 g
-
Lurpak lighter spreadable butter and vegetable oil, slightly salted - 500 g
-
Reduce fat homous - Lidl - 200 g
-
Soft Cheese - Pilos ( Lidl ) - 275 g
-
Smoked Humous - Moorish - 150g

-
Light Cheese Triangles - The Laughing Cow

-
Spread - Stork - 500g

-
Spread without Palm Oil - Eat Plants Free of Palm - 450g

-
Houmous - Waitrose - 300g
-
Classic Houmous - Meadow Fresh
-
Red pepper houmous - Tesco

-
Marmite truffle - Unilever

-
Flora Lighter - 450g E

-
Spalmabile - Light - Milbona - Lidl - 300 g
-
Red pepper houous - 200g
-
Creamy spreadable cheese - The laughing cow - 133 g
-
Cheese Triangles - Valley Spire - Lidl - 400g - 24 x 16g
-
Sweet chilli houmous - Tesco

-
Classic Houmous - delphi - 170 g

-
Spreadable - - 750 g

-
Classic houmous - By sainsbury's

-
Red pepper houmous - Lidl - 200 g
-
Houmous xxl - Aldi - 300g
-
Original Hummus - Holy Moly - 150g

-
Black Tapenade

-
Essential Houmous - Waitrose - 200g
-
Smoky Roasted Red Pepper Houmous - Sainsbury's - 200g

-
Olive Spread - Waitrose - 500 g
-
Taramasalata - Waitrose - 170 g
-
classic Houmous - Sainsbury's
-
3 houmous - Tesco

-
Houmous - TESCO - 300g
-
Fromage à la crème - Elle & Vire - 150 g
-
Yeast Extract - ASDA - 240 g
-
Houmous - Stamford Street Co. - 200g

-
Houmous - Asda
-
-
Goldessa Cream Cheese with Herbs - 200 g
-
Fat Free Cottage Cheese - Tesco - 300g

-
Reduced fat houmous - Tesco - 200g
-
Reduced fat houmous - Lidl

-
Classic houmous - M&S - 200g

-
Original cheese

-
The best houmous topped with pesto & pine nuts - Morrisons - 170 g

-
Mezze houmous + rainbow veg grain bowl

-
Rich Taramasalata - By Sainsbury's
-
Moroccan Inspired Houmous - The deli - 200 g

-
Original Creamy Soft Cheese - ASDA - 200g

-
Dynamite marmite
-
Bio Hummus Kichererbsenpuree mit Sesam und rotem Pesto - W - 175 g
-
Houmous - Tesco - 200g
-
Tesco Soft Cheese 50% less fat - 200g

-
Lactofree Soft Cheese - arla - 200 g
-
Natural Cottage Cheese - By Sainsbury's
-
Houmous Classic - Sabra mezze - 250 g

-
Olive spread - Asda
-
Extra virgin olive houmous - Lidl - 150 g
-
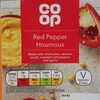
Red pepper houmous - Coop